Response spectra, displacement animations, inter-storey drift and rotation allow for more indepth data to be collected and provide an informed decision on whether a building should be evacuated or is safe to remain in.
• Data can be exported as a CSV to integrate into other engineering products for modelling.
• Create an API data feed to deliver into those systems.
Benefits to engineers
If multiple buildings are being monitored engineer’s can triage their buildings and manage their client request easier. Clients can ensure they meet Health & Safety regulations and gain Economic Benefits.
If the building status is:
Green—Client and engineers are notified and building retains normal occupancy – thresholds not met.
Green – Normal occupancy
Orange—Inspection recommended, thresholds met. Engineers do desktop or onsite assessment, either change status to green or other restricted access.
Orange – Inspection recommended
Red—Engineers assess data and building and can change status lower if cleared; or restrict – allowing action of business continuity plans.
Red – Entry prohibited
If you would like to provide simple easy to understand information on our Structural Health Monitoring System to your clients, let us know and we can book a presentation to assist.
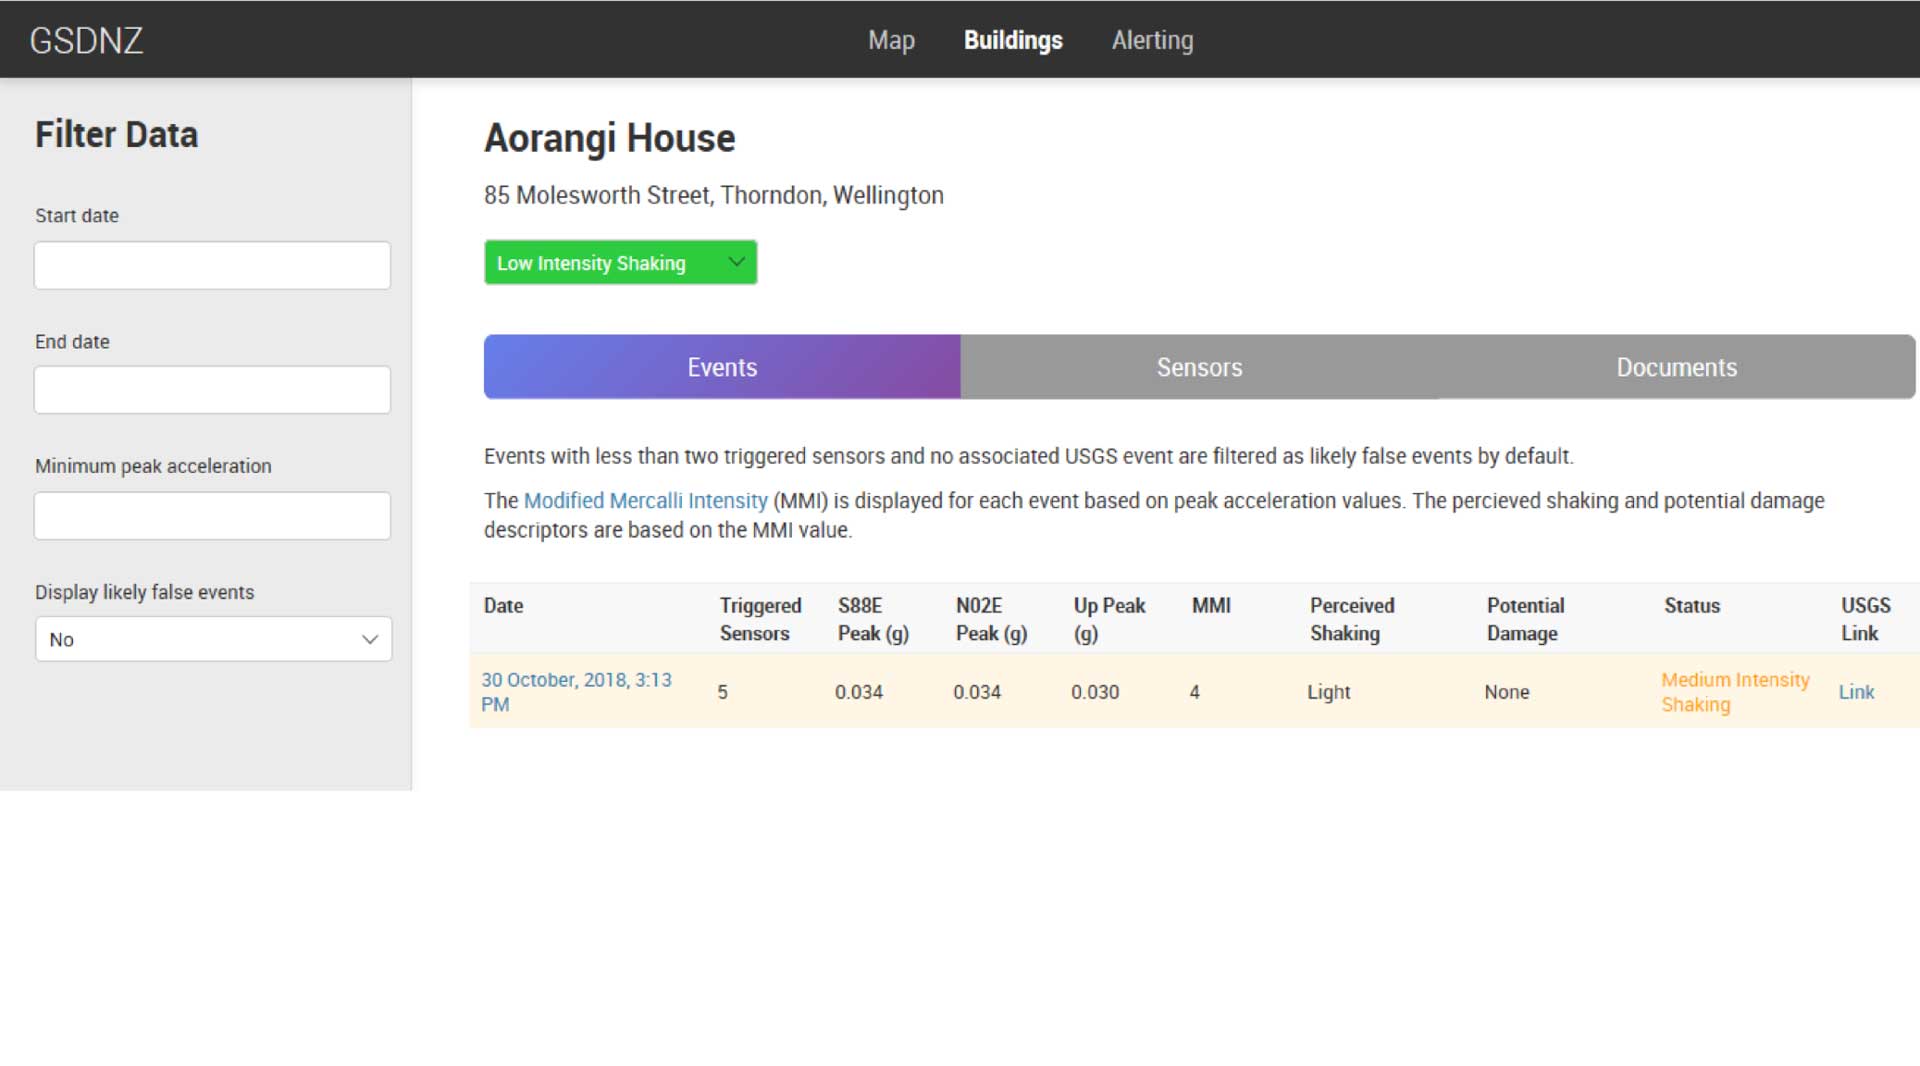
The data shows the event, number of sensors triggered; and links to GNS or USGS event, the perceived shaking and MMI level based on data.
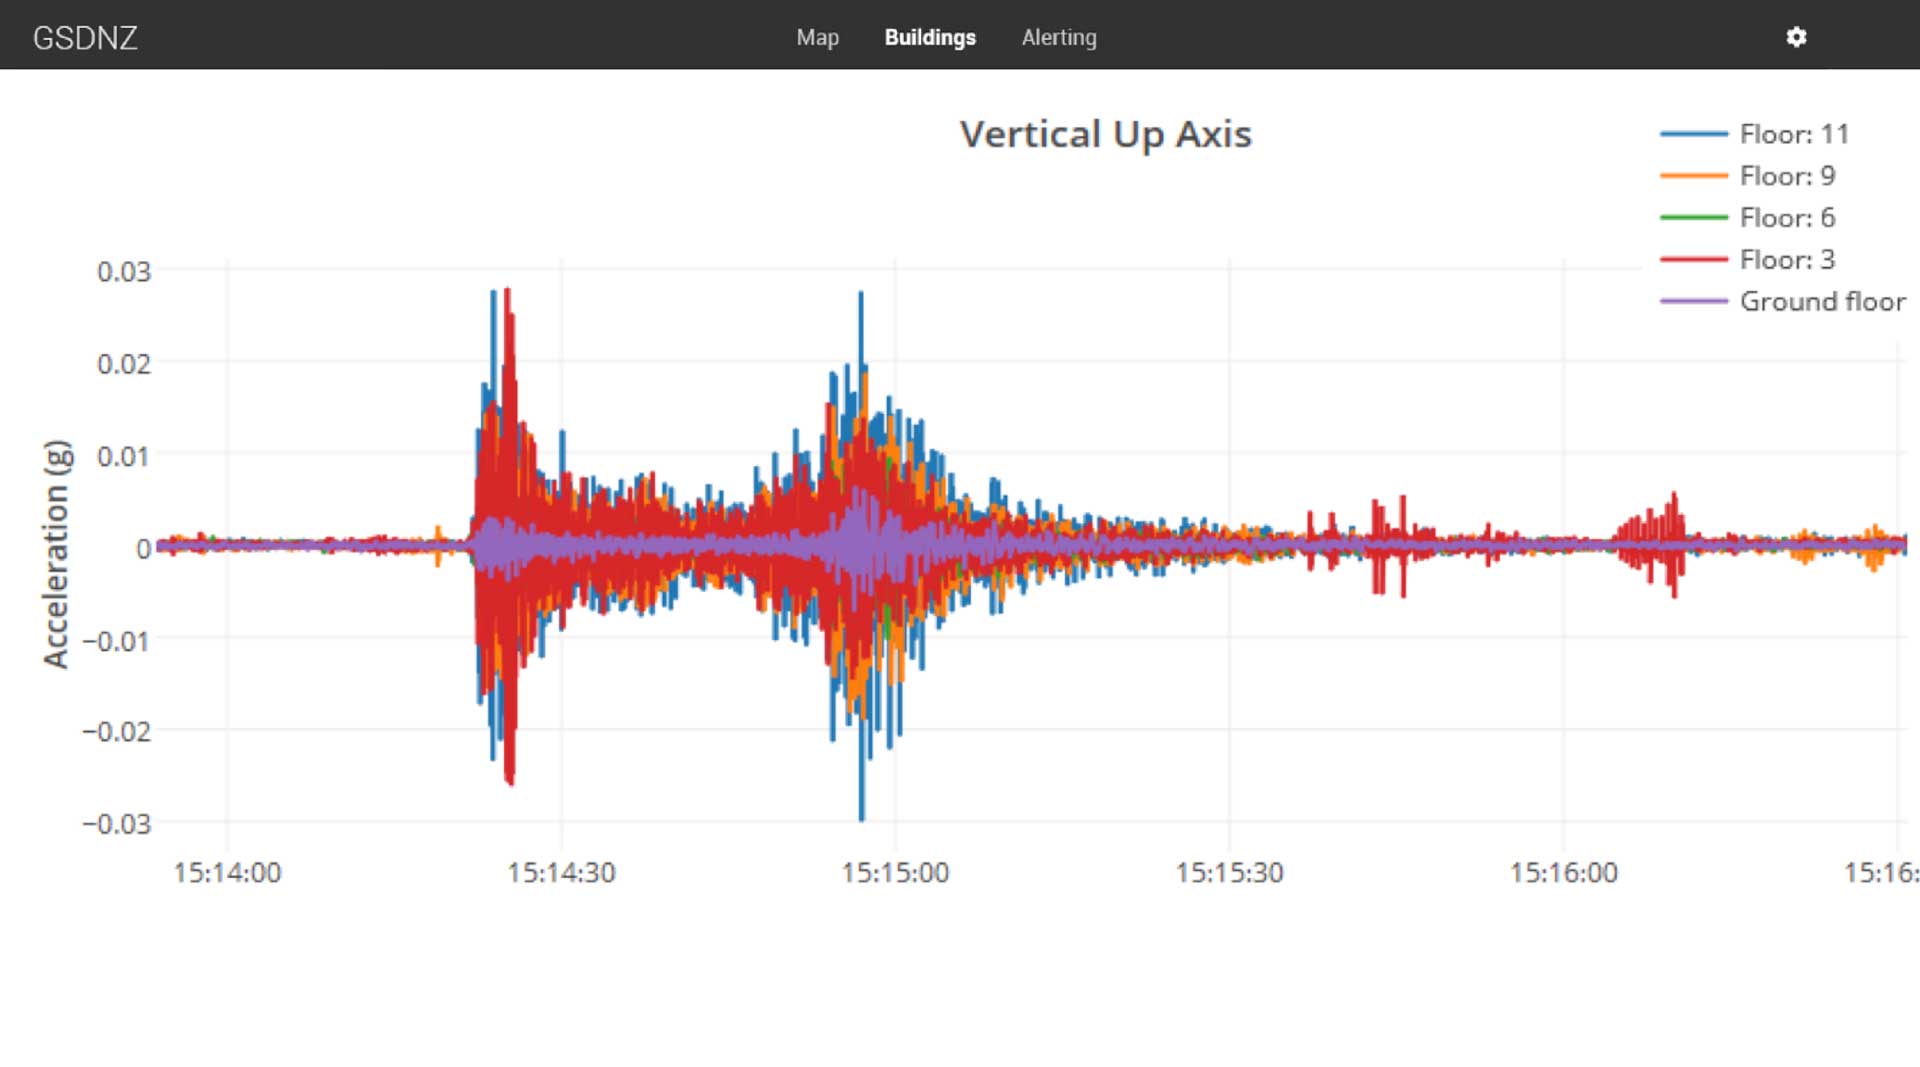
Shows event, sensors that triggered, acceleration on north/south, east/west and vertical in G force.
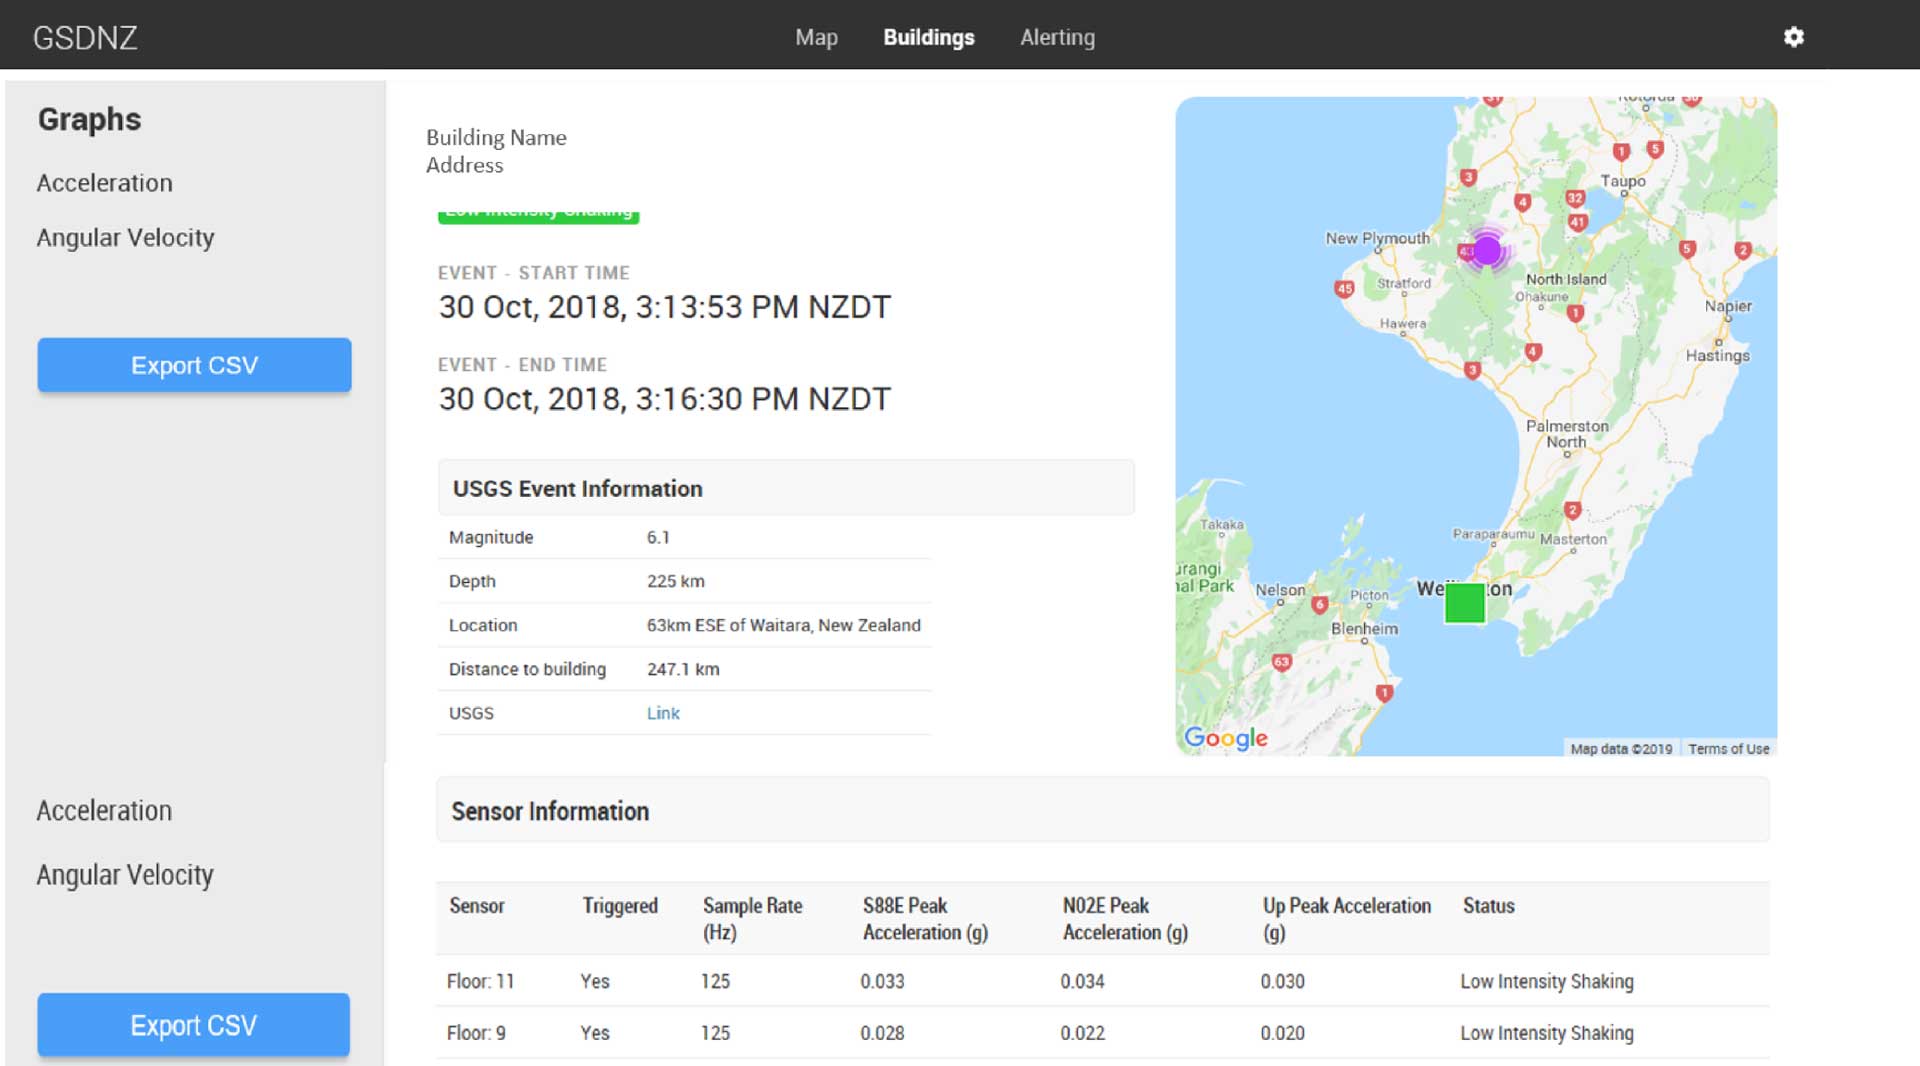
The event data can be downloaded by engineers in a CSV file.
Data breakdown by floor.
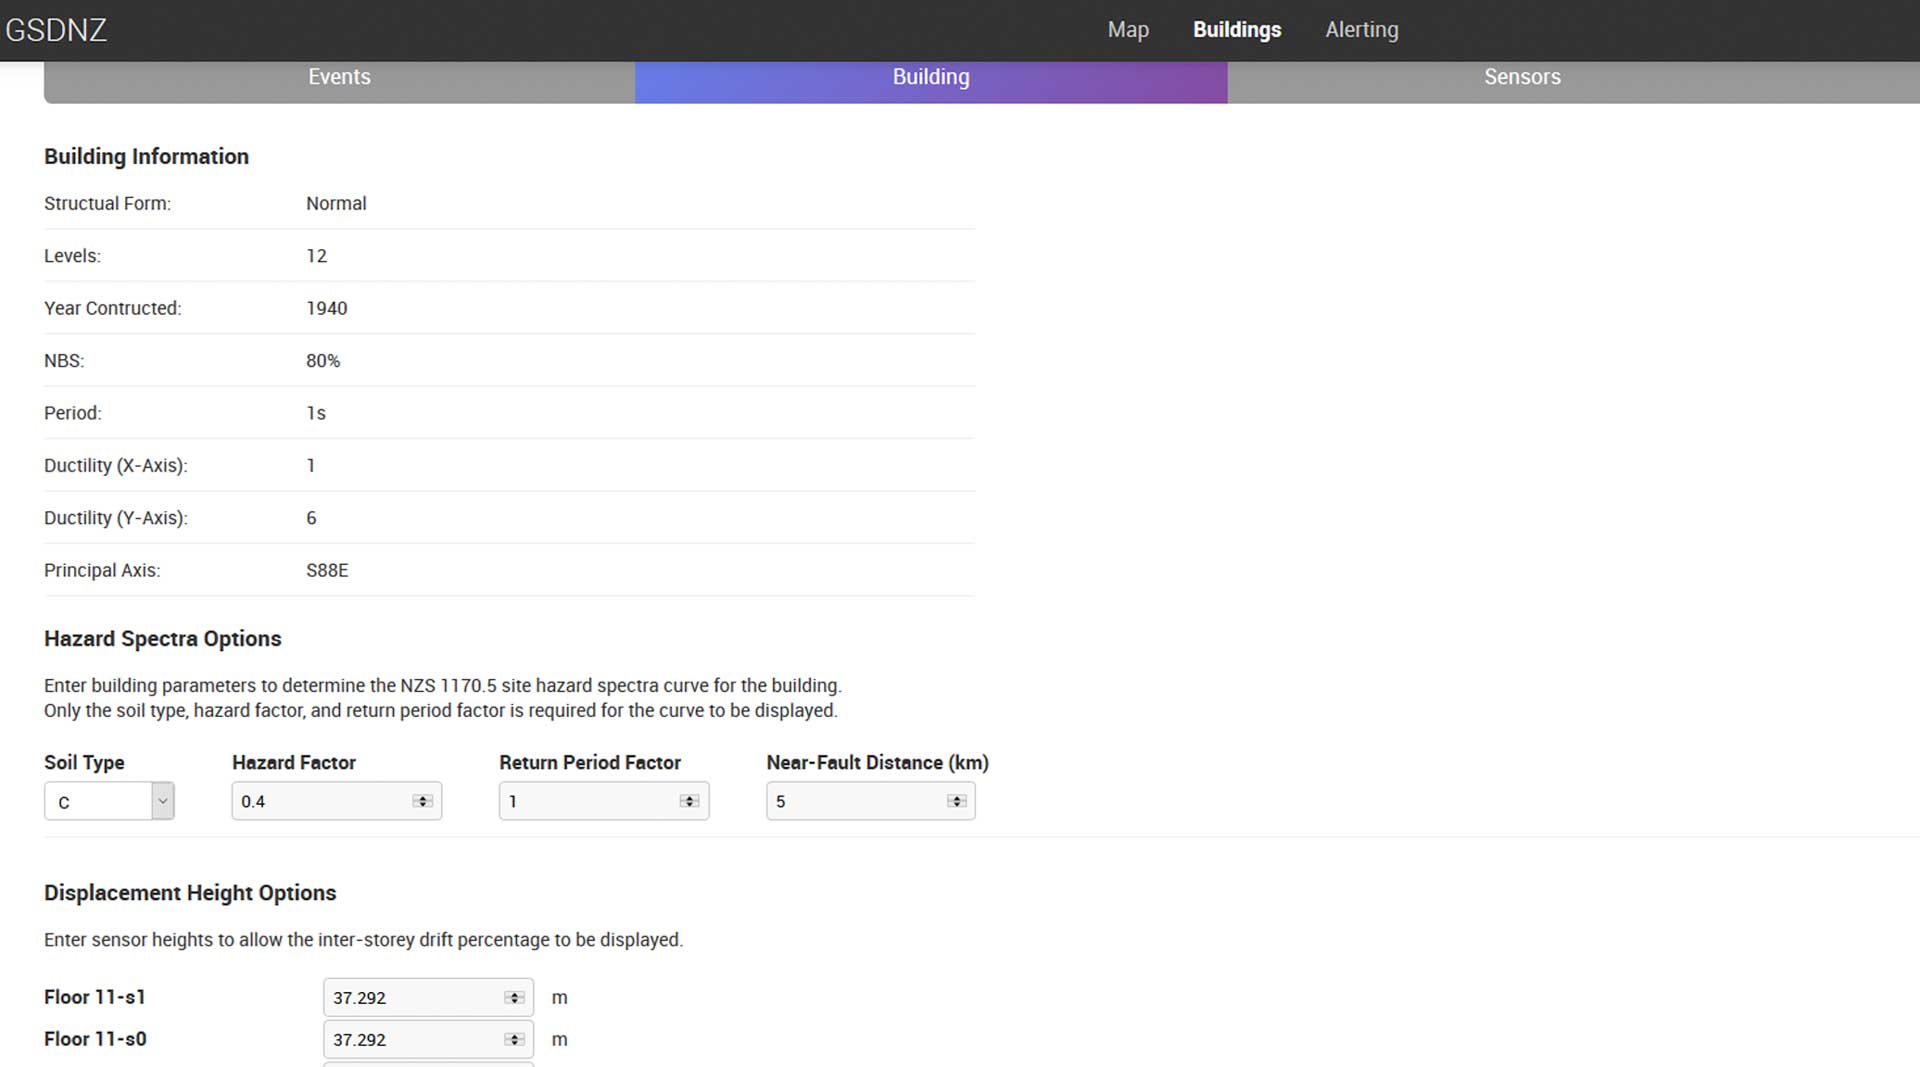
RESPONSE SPECTRA CURVES
We have developed response spectra curves to the current NZS1170.5 standards. These are customised to a building when an engineer completes or enters:
Soil type
Hazard factor
Return period factor
Near fault distance.
Post event, the response curve is produced and functionality alters the setting to view change of response spectra positioning and building status. Building ductility and key building metrics are also instantly accessible.
Engineers can modify or adjust response settings and change:
Resolution, max period, units
Damping
Change spectra settings
Recalculate graph plots.
BUILDING DISPLACEMENT
Displacement can be absolute or relative to ground and is calculated based on a double integration of event data. This can be provided as raw unfiltered data, with actual noise measured in mm, m or as %.
The three graphs are different representations of the same event data:
Standard filtering high-pass filter on
High-pass filtering turned off providing raw data
High-pass filtering on, with a filter frequency of 0.8Hz to remove some noise.
MULTI-LEVEL REPORTING
Inter-storey drift is calculated based on a double integration of event data which can be measured between two floors or over multiple levels in m or as %.
To calculate the actual floor heights as per the plans, sensors that are on the ground and other floors must be added.
The building tab has a space for response spectra to be set up.
SDS number will show floor level beside it.
We also record other useful information to assist engineers making rapid assessment of a building.
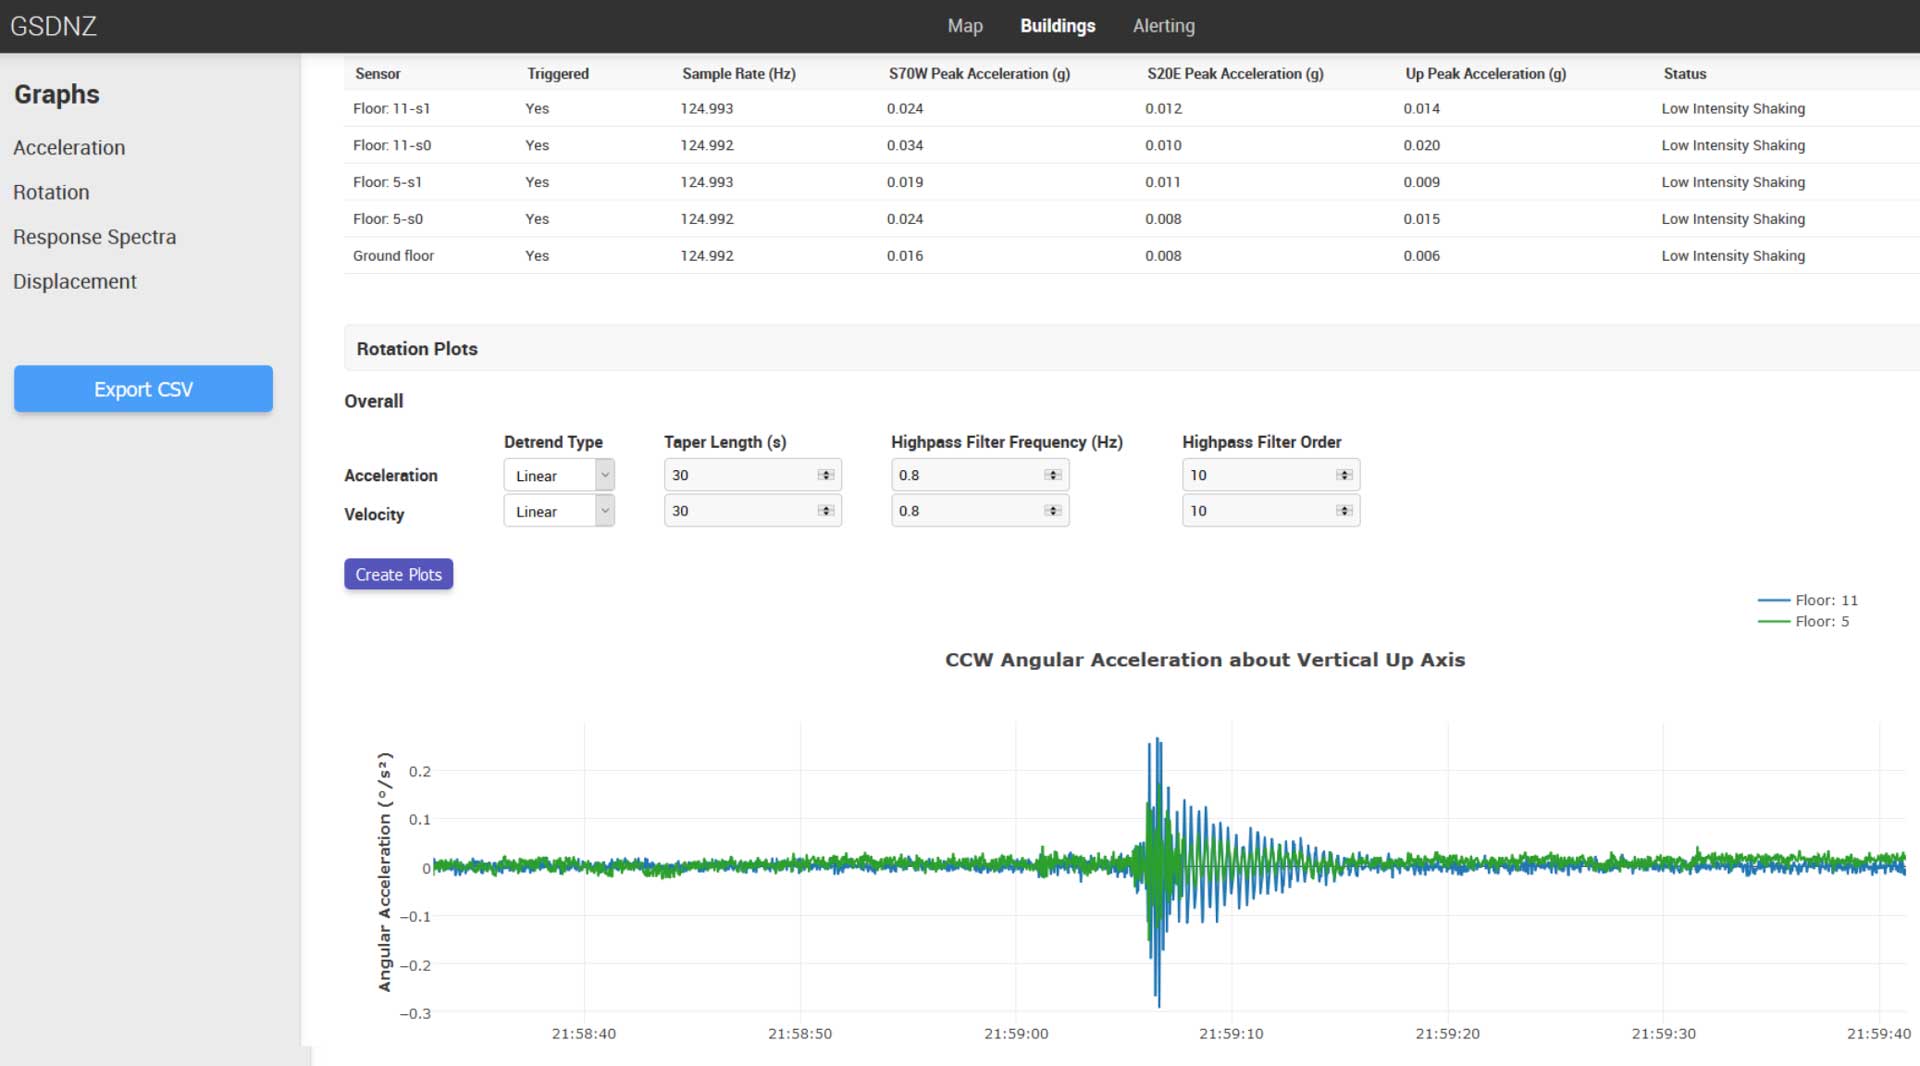
ROTATION
Rotation is calculated by placement of two sensors on a floor, then two sensors on a different floor with sensors in the same floor position.
We change the high-pass filter frequency to 0.8 to remove noise.